About 'guiplot' R Language Package
2020-04-07
概述
“guiplot”是由付永超开发的一个帮助用户通过图形界面来完成图表绘制的工具,旨在实现无代码的方式实现绘图。
“guiplot”包的Github链接:https://github.com/s0521/guiplot
使用方式:
1加载数据
- 1.guiplot() 直接使用上述代码,guiplot包会读取当前R语言所加载的数据,并使用该数据来完成图表的绘制。 guiplot包仅支持矩阵或者数据框类型的数据来完成图表的绘制
- 2.guiplot(…) … 可以是一个已加载数据的名称,或者是多个已加载数据的名称。 guiplot包仅支持矩阵或者数据框类型的数据来完成图表的绘制
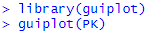
- 2.1guiplot(PK) guiplot包内置了一个名为PK的数据集,用户可以直接通过上述代码来调用该数据集绘制。
- 2.2guiplot(PK,PK) guiplot包可以同时加载多个数据集用于绘图。
- 2.2guiplot(“PK”) guiplot包内置了一个名为PK的数据集,用户可以直接通过上述代码来调用该数据集绘制。
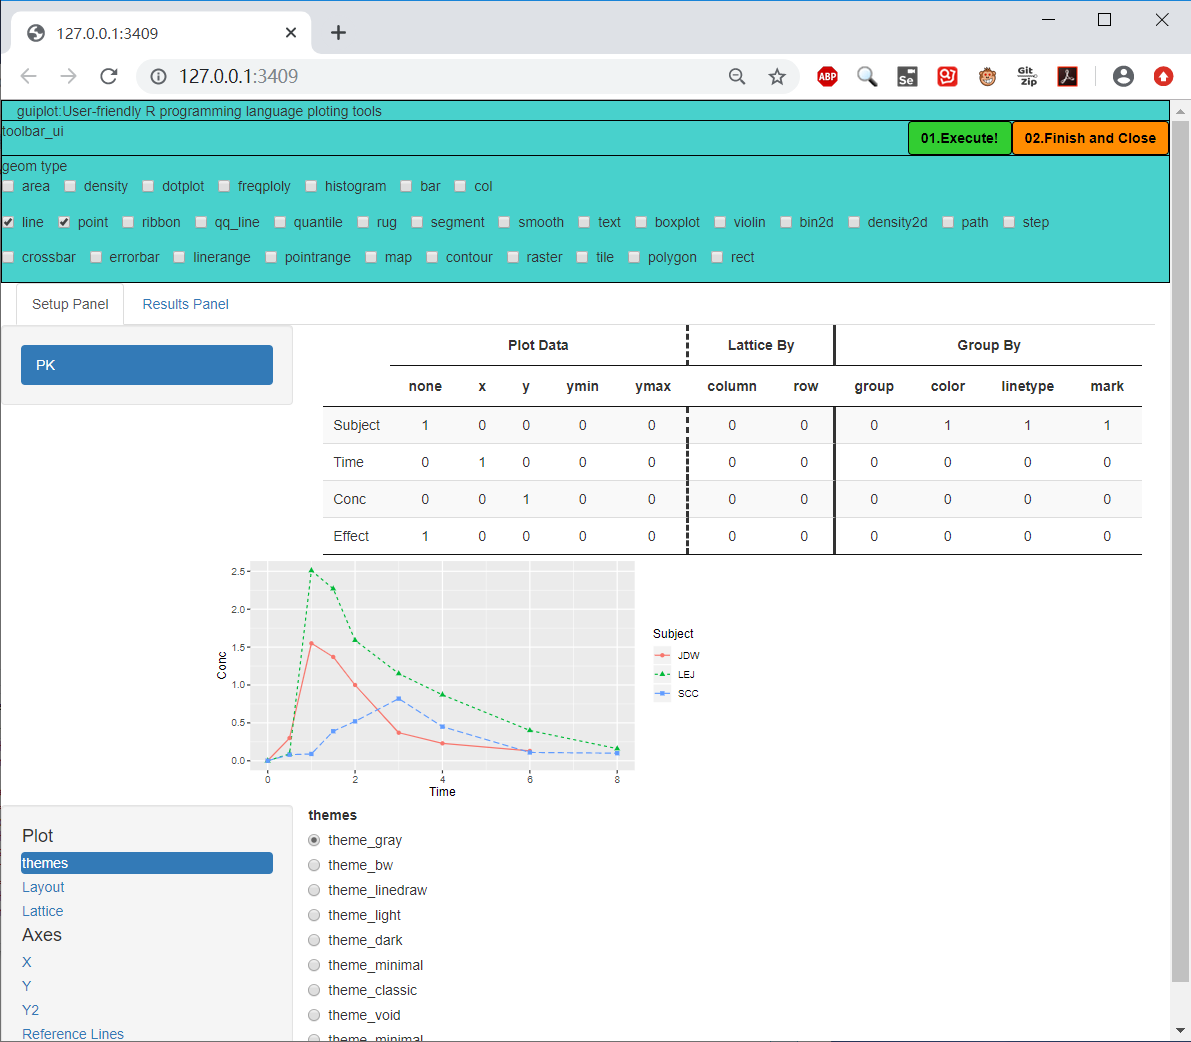
2选择图表类型
打开用户界面后,用户需要首先选择绘制的图形的类型
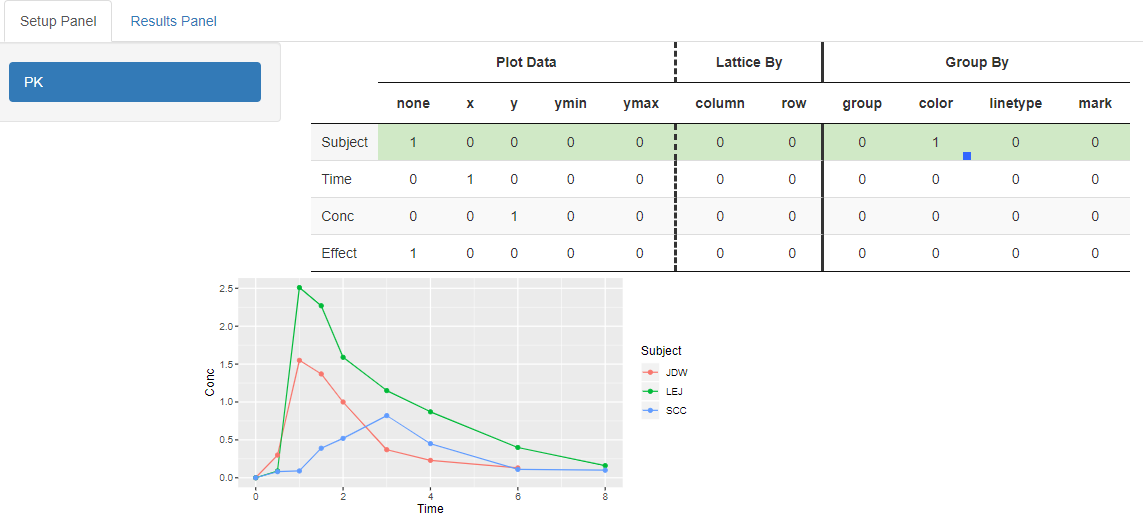
3进行数据映射
用户通过映射列表告诉“guiplot”该如何使用数据完成图表的绘制
列表的第一列展示了所加载的数据集所包含的列的列名
列表的第一行展示了当前所需要映射的一些字段
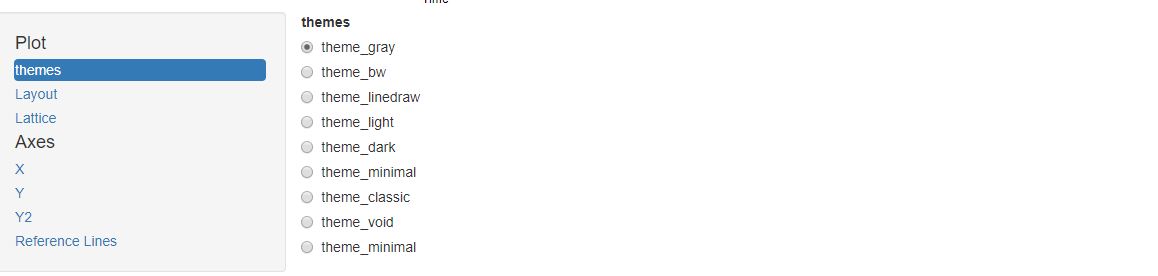
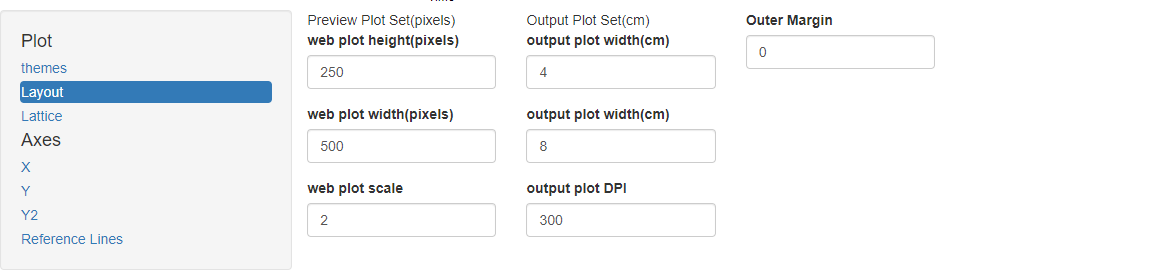
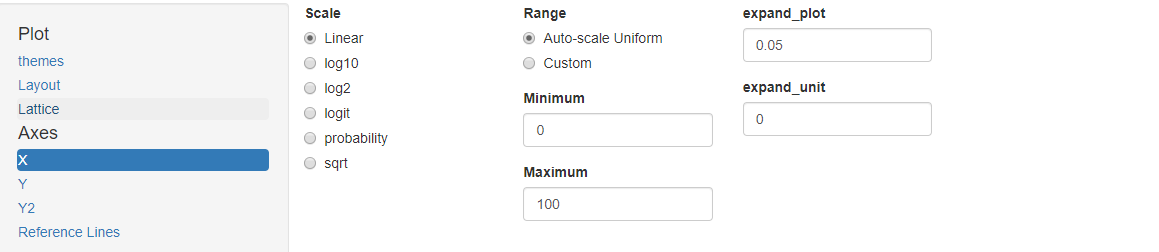
4进行美学调整
用户可在该区域完成对绘制出的图形的一系列的基于美学的调整,包括:主题、画布的规格、最标轴的尺度、坐标轴的范围等内容的设置
5执行图表绘制
单击工具栏中的“执行!(Execute!)”按钮,会在当前工作目录下生成所绘制出的图形,会输出三种格式“pdf”、“png”、“svg”。
6退出
单击工具栏中的“完成并关闭(Finish and Close)”按钮,会停止当前的会话,结束GUI互动。
已知问题:
无法对映射到Y字段的多个变量,使用颜色、线型、标志符等进行区分。
Overview
The author of “guiplot” is Fu Yongchao.
The role of “guiplot” is to help users to complete the chart drawing tool through the graphical interface,
The goal of “guiplot” is to implement drawing without code.
The Github link of “guiplot” is https://github.com/s0521/guiplot
How to use guiplot:
1 Load data
-
1.guiplot () Using the above code directly, the guiplot package will read the data loaded in the current R language and use this data to complete the drawing of the chart.
-
2.guiplot (…) … can be the name of one loaded data, or the name of multiple loaded data. Guiplot package only supports matrix or data frame type data to complete chart drawing
- 2.1guiplot (PK) The guiplot package has a built-in data set called PK, and users can call this data set replacement directly through the above code.
- 2.2guiplot (PK, PK) The guiplot package can load multiple data sets for plotting at the same time.
- 2.2guiplot (“PK”) The guiplot package has a built-in data set called PK, and users can call this data set replacement directly through the above code.
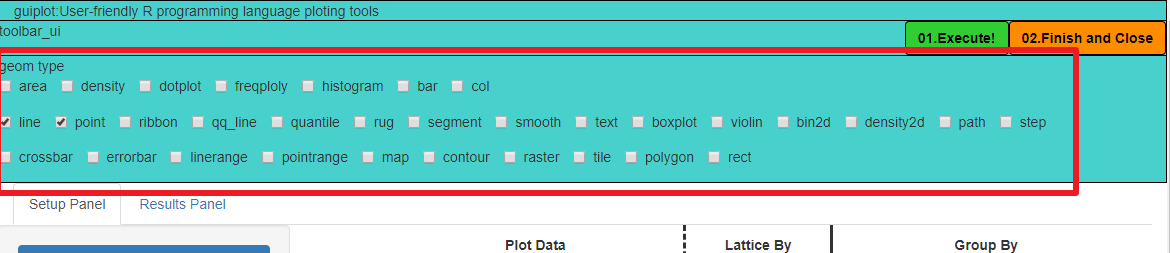
2 Select the chart type
After opening the user interface, the user needs to first select the type of graphics drawn.
3 Perform data mapping
The user tells “guiplot” how to use the data to complete the layout of the chart through the mapping list
The first column of the list shows the column names of the columns contained in the loaded data set
The first line of the list shows some subdivisions that need to be mapped currently
4 Make aesthetic adjustments
The user can complete a series of aesthetic-based adjustments to the placed graphics at this area, including: themes, specifications of the canvas, the scale of the most standard axis, the range of the coordinate axis, etc.
5 Perform chart drawing
Click the “Execute!(执行!)” Button in the toolbar, the drawn graphics will be generated in the current working directory, and three formats “pdf”, “png”, and “svg” will be output.
6 Exit
Clicking the “Finish and Close(完成并关闭)” button in the toolbar will stop the current session and end the GUI interaction.